Midpoint Rule Calculator
How to calculate approximate midpoint area using midpoint
rectangles A great way of calculating approximate area using
rectangles is by making each rectangle cross the curve at the
midpoint of that rectangles top side. It is said that the Midpoint
rule Calculator provides a better estimate of the area as
compared to the left – rectangle or right – rectangle sum. The
below figure shows why.

In the figure above, you can see the part of each rectangle that is above the curve that it looks the same size as the gap between the rectangles as well see the curve. Using A midpoint sum gives a significant estimate of these two errors roughly cancelling out each other.
The figure above shows how to use three midpoint rectangles to calculate the area under From 0 to 3. For all the three rectangles, their widths are 1 and heights are f (0.5) = 1.25, f (1.5) = 3.25, and f (2.5) = 7.25. Area = base x height, so add 1.25 + 3.25 + 7.25 and the total area 11.75. Using definite integral, one can find that the exact area under this curve turns out to be 12, so the error with this three-midpoint-rectangle is 0.25. Contrast with errors of the three-left-rectangles estimate and the three-right-rectangles estimate of 4.0 and 5.0, respectively.
Here is the official midpoint calculator rule:
Midpoint Rectangle Calculator Rule—It can approximate the exact area under a curve between points a and b,
Using a sum of midpoint rectangles calculated with the given formula. It has believed the more rectangles; the better will be the estimate:
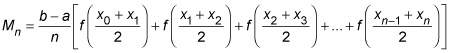
Where, n is said to be the number of rectangles,

Is the width of each rectangle, and function values are the heights of rectangles? A limit problem asks one to determine what the value of a function is zeroing in on as the x value approaches a particular number. With the calculator, one can solve a limit problem using graphing mode.
To begin, enter the limit expression in graphing or “y =” mode, in Table Setup, set Tbl to start to the arrow-number, and then set.
ΔTbl
To something small like 0.01 or 0.001. When you see the table, you will mostly see the y values getting closer to the limit answer as homes in on arrow-number. If it’s not clear what the y values are approaching, try a smaller increment for the ΔTbl Number. This is a method that often gives one a good idea of what’s happening in a limit problem.